Solvvy Workflow Analytics
When I started this project, customers using Solvvy’s most popular feature really struggled to understand how their AI chatbot was performing, or what their users were saying to it. This was leading to uncertainty of the end user experience, and of how to improve the chatbot to save more money.
Overview
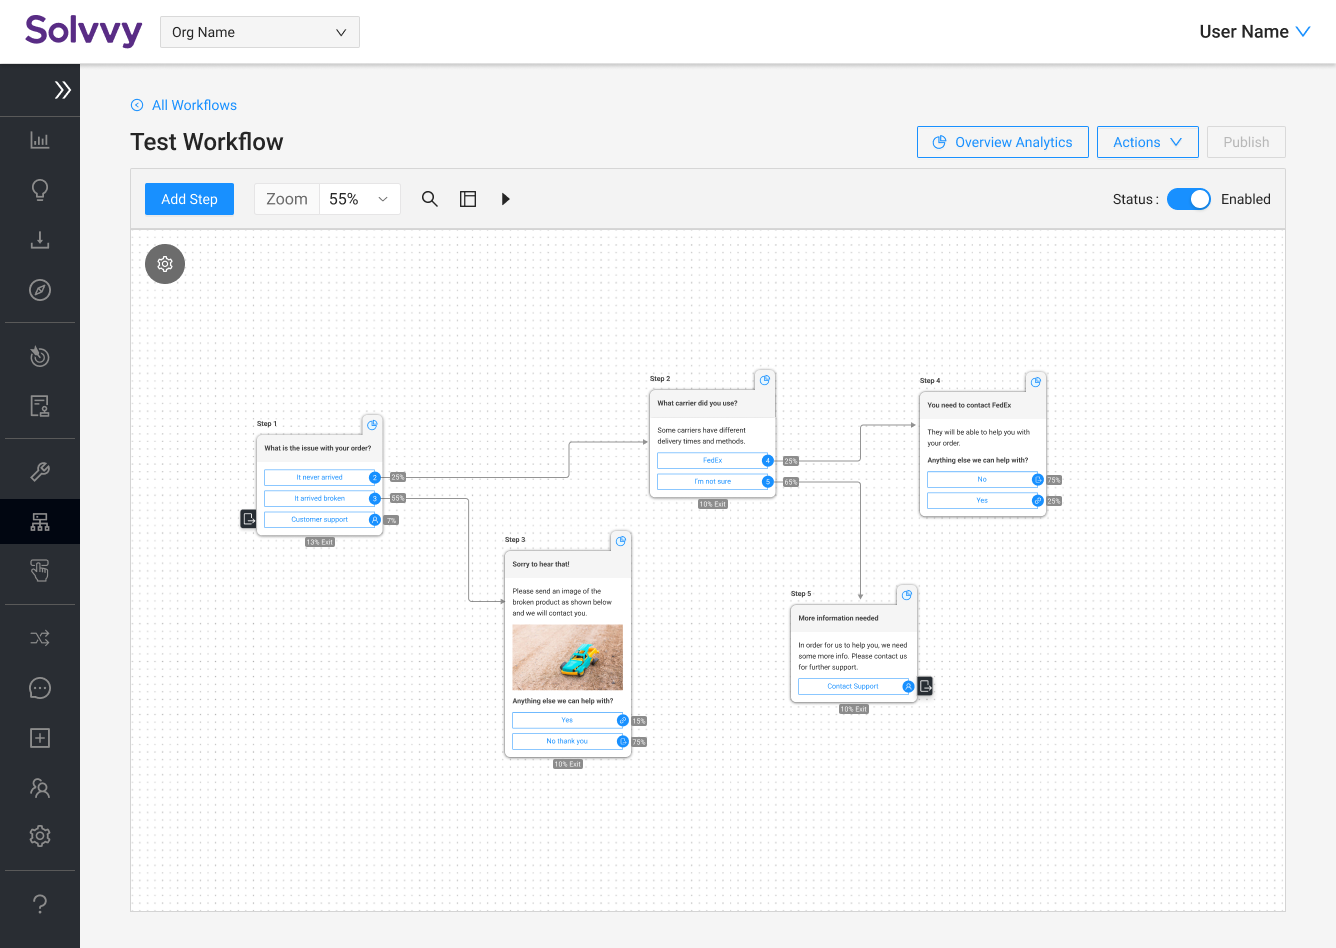
Solvvy is a chatbot-as-a-service product that uses AI, ML, and NLP in order to solve the client’s end user needs, and save the company money by resolving common issues. The chatbot can be connected to knowledge bases where it can serve relevant article snippets based on the user’s intent. Another more effective way to solve issues from customers is to initiate client-made workflows based on end user intent. These are pre-made user journeys to solve common issues. Workflows have a significantly higher self-service rate, and typically lead to more satisfied end users, and more saved money for the client.
An important aspect of workflows is the ability to know if they are working correctly. Analytics for chatbots and specifically this feature are crucial, and this project was centered around increasing visibility and ease of understanding around workflows and how it affects the client’s experience.
The Problem
Clients were able to build workflows, and loved the results they saw. The issue is, they were unable to tell how they were working, or where they could be improved. There were some analytics, but they were confusing and didn’t answer the questions our clients wanted to know.
Time to talk to some clients to learn more about the problems and opportunities!
Discovery Research
Preliminary internal interviews were initially conducted to gain a better perspective about the problem hypothesis. After talking to several people throughout the company, external conversations were necessary in order to empathize with our customers and really understand what their problems are. I used a combination of surveys, interviews, and contextual inquiry with a diverse group of our clients in order to understand how they are currently using the workflows analytics, and what pain points they have.
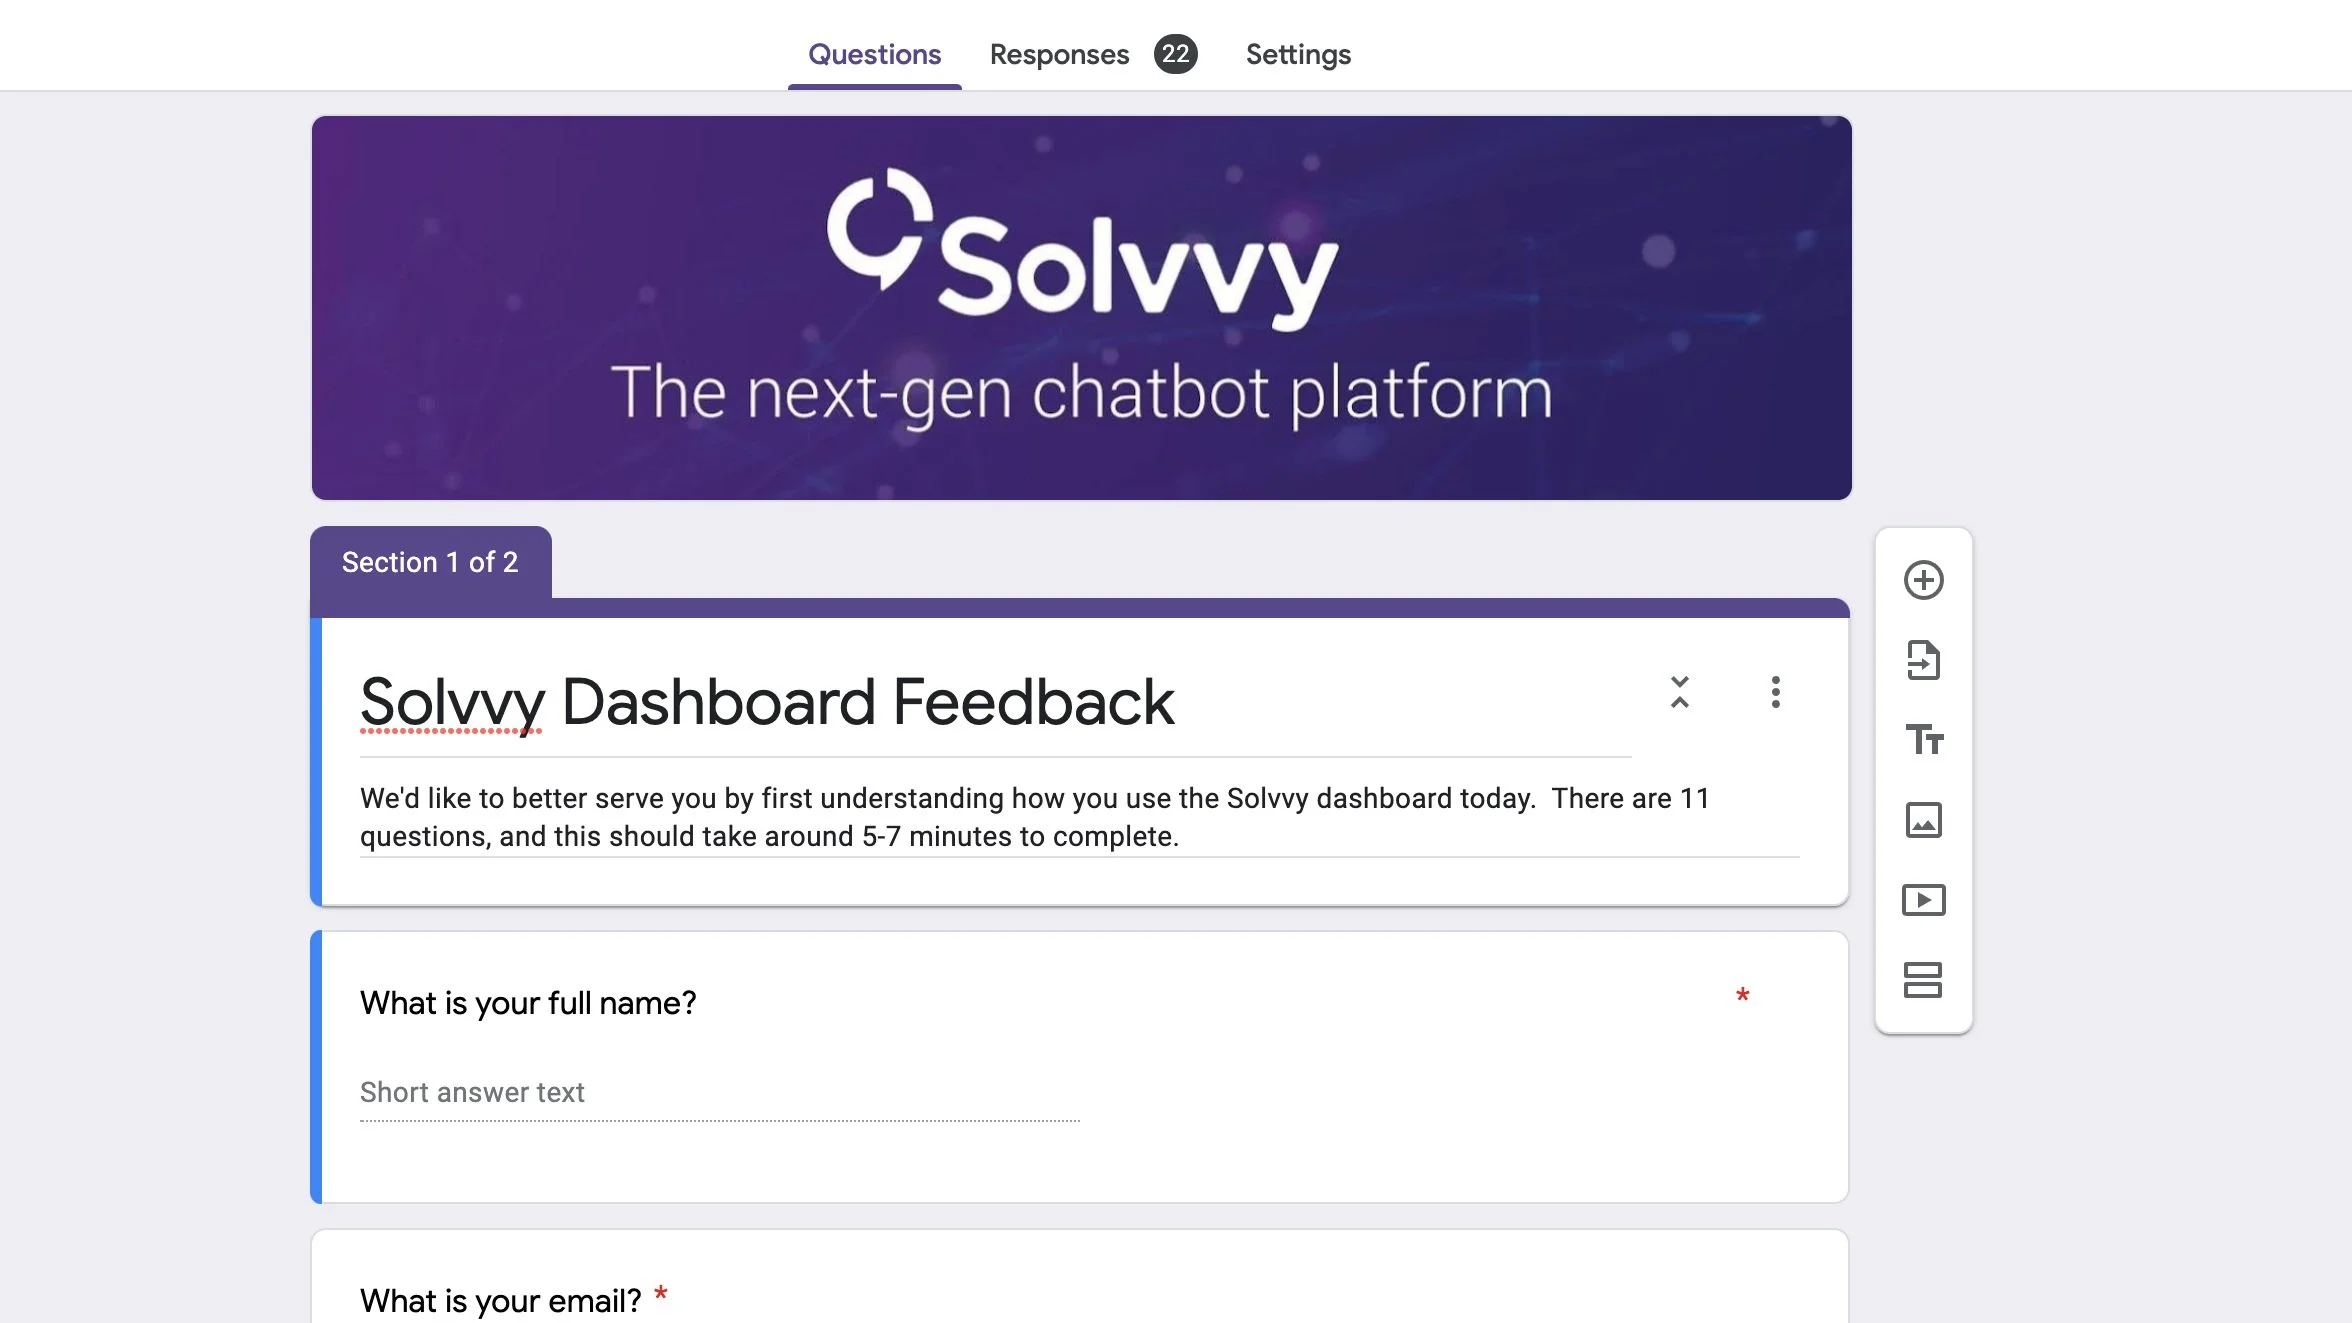
Initial survey
For recruitment and client persona organization, I needed to reach out to a variety of clients to get the most holistic understanding.
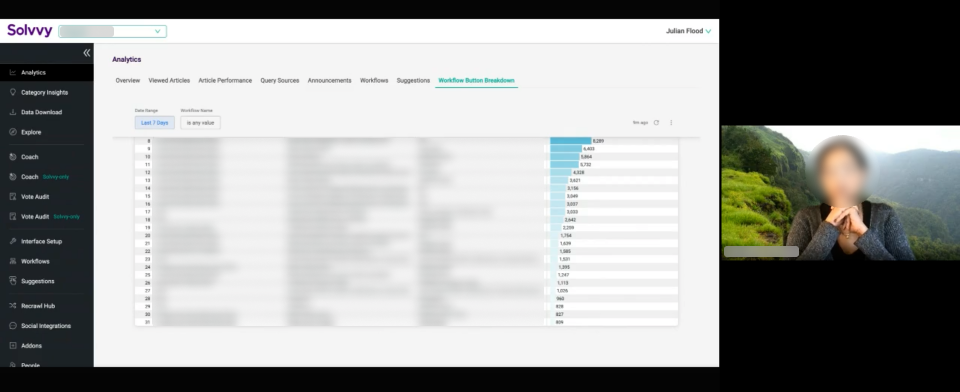
Client Interviews
In order for me to understand the pain points and opportunity potential, I needed to talk to some real users.
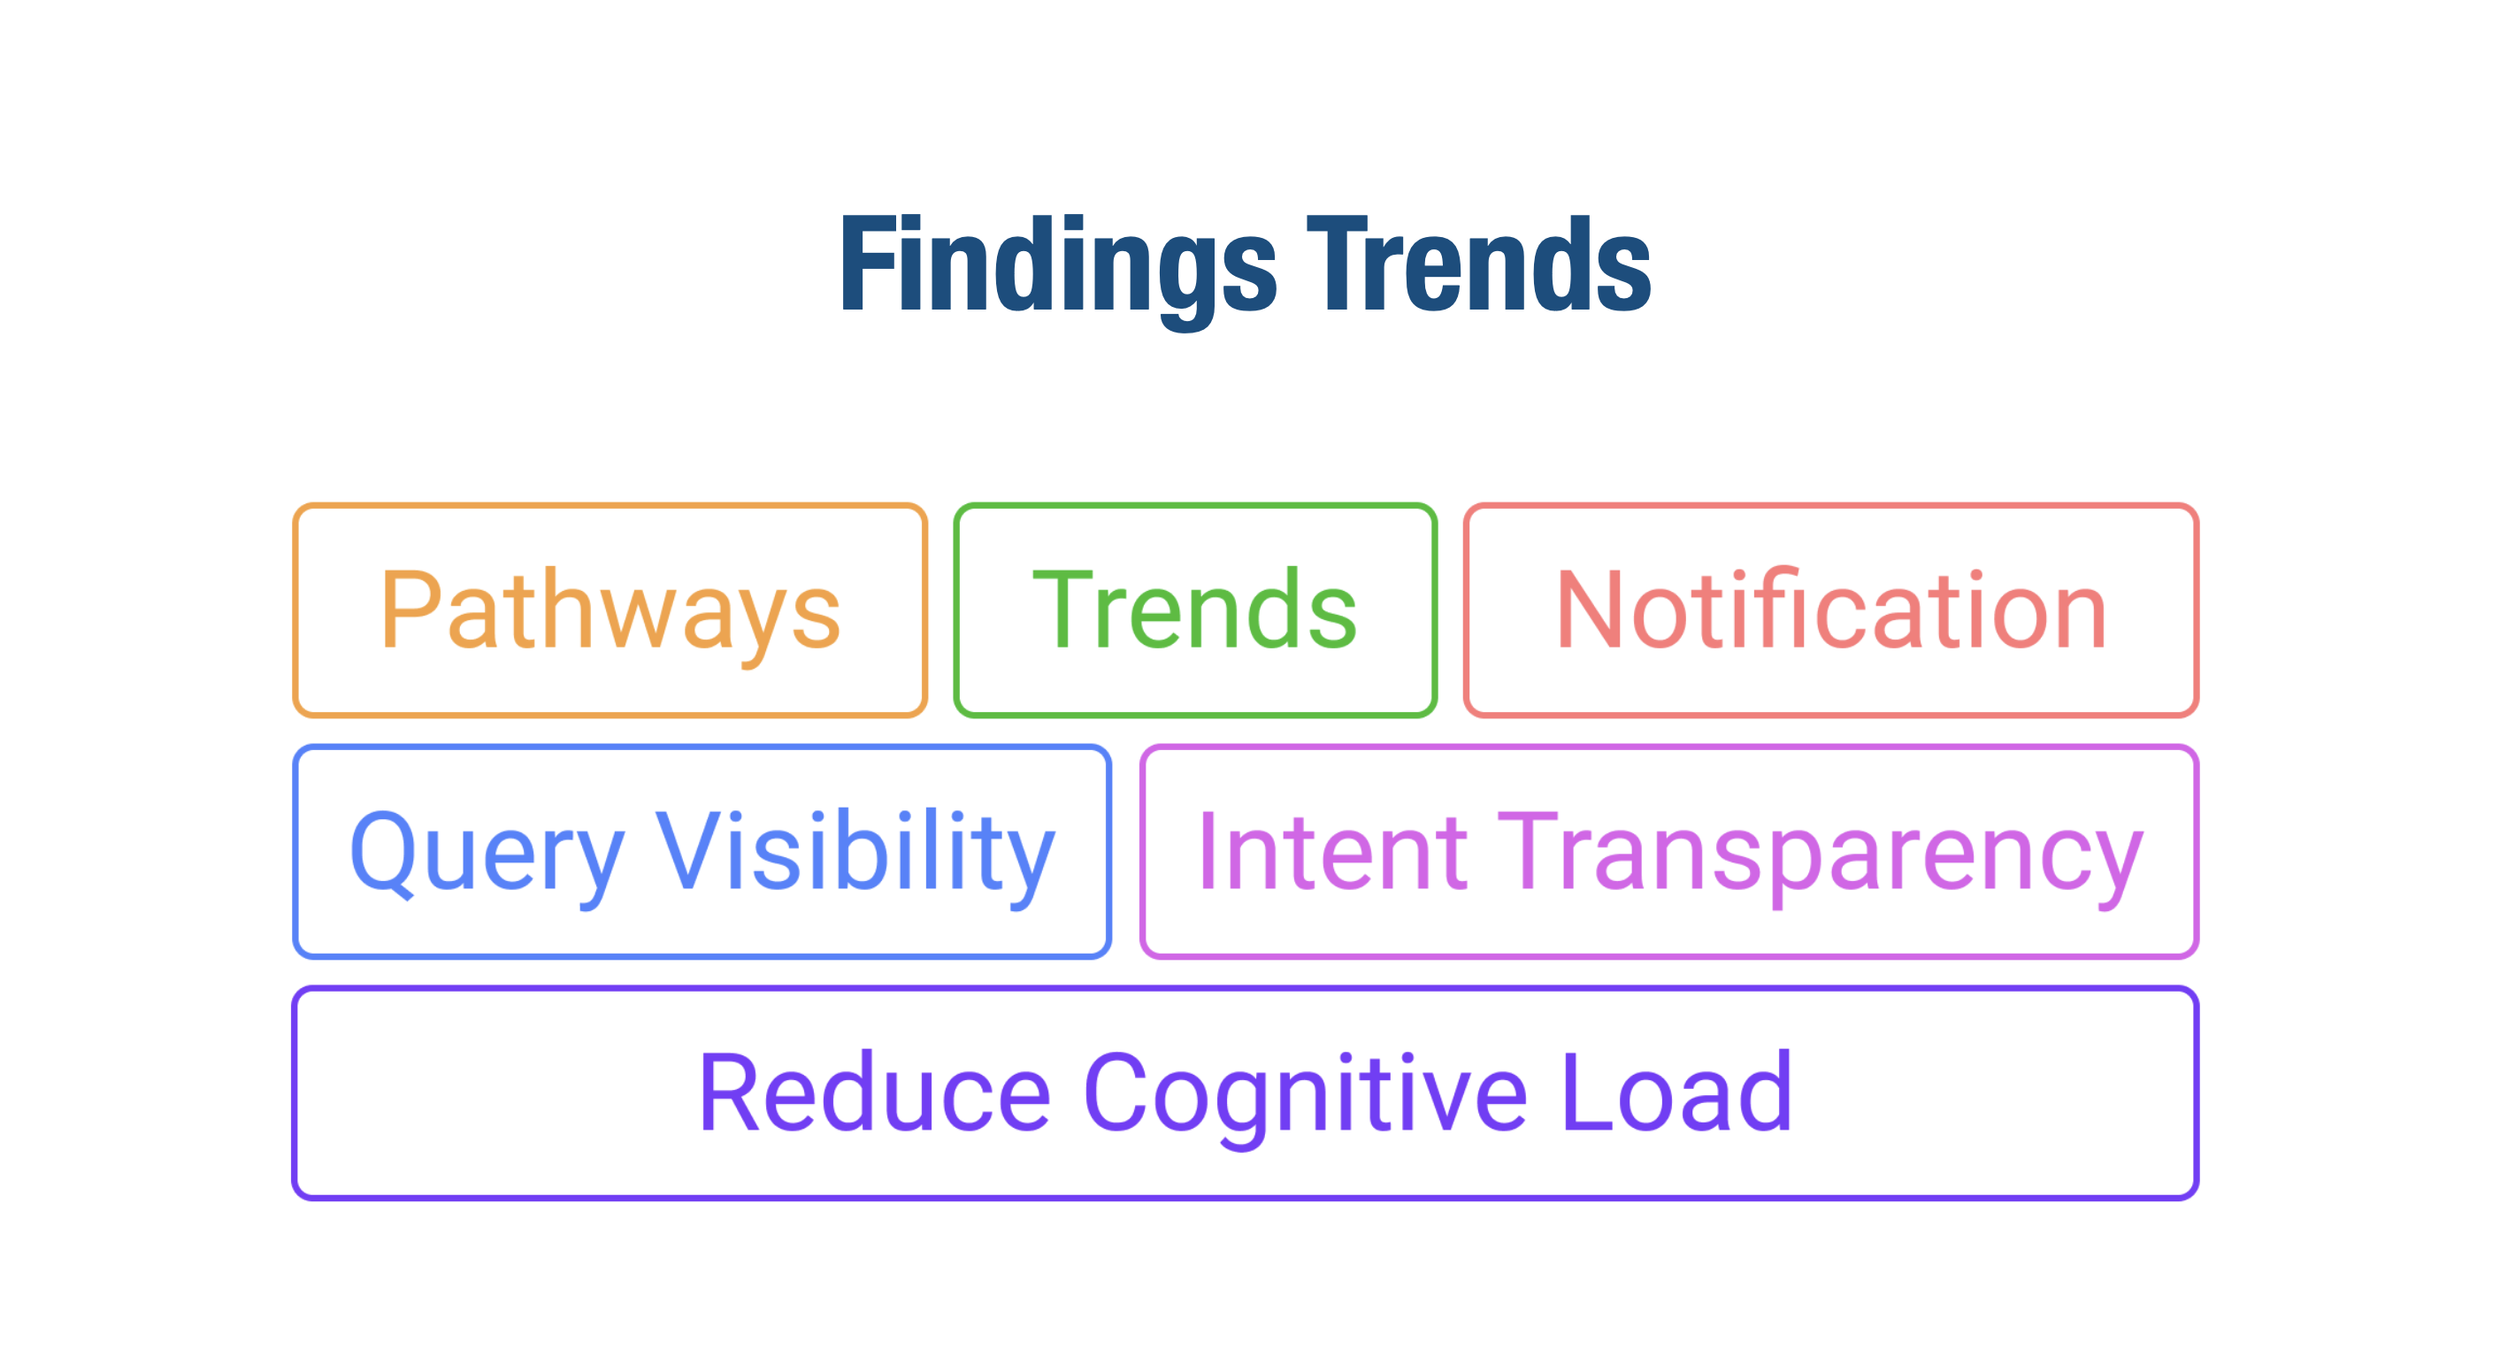
Discovery Findings
Findings from the discovery research yielded some common themes.
Current analytics were too heavy and static. They didn’t answer any questions, but just repeated information they already knew.
There was no user journey information. Clients needed to know how their customers were interacting with the bot in order to improve it’s performance.
Information architecture was confusing for our analytics and other core features.
Most personas that used the dashboard to monitor changes in their workflows used Solvvy as a fraction of their workday, so having actionable analytics immediately available was the only way they were going to know something was wrong. They didn’t have a ton of time to search for it.
And a lot more.
Company Readout
I presented my findings on my research with the company so that we had transparency about what clients were experiencing.
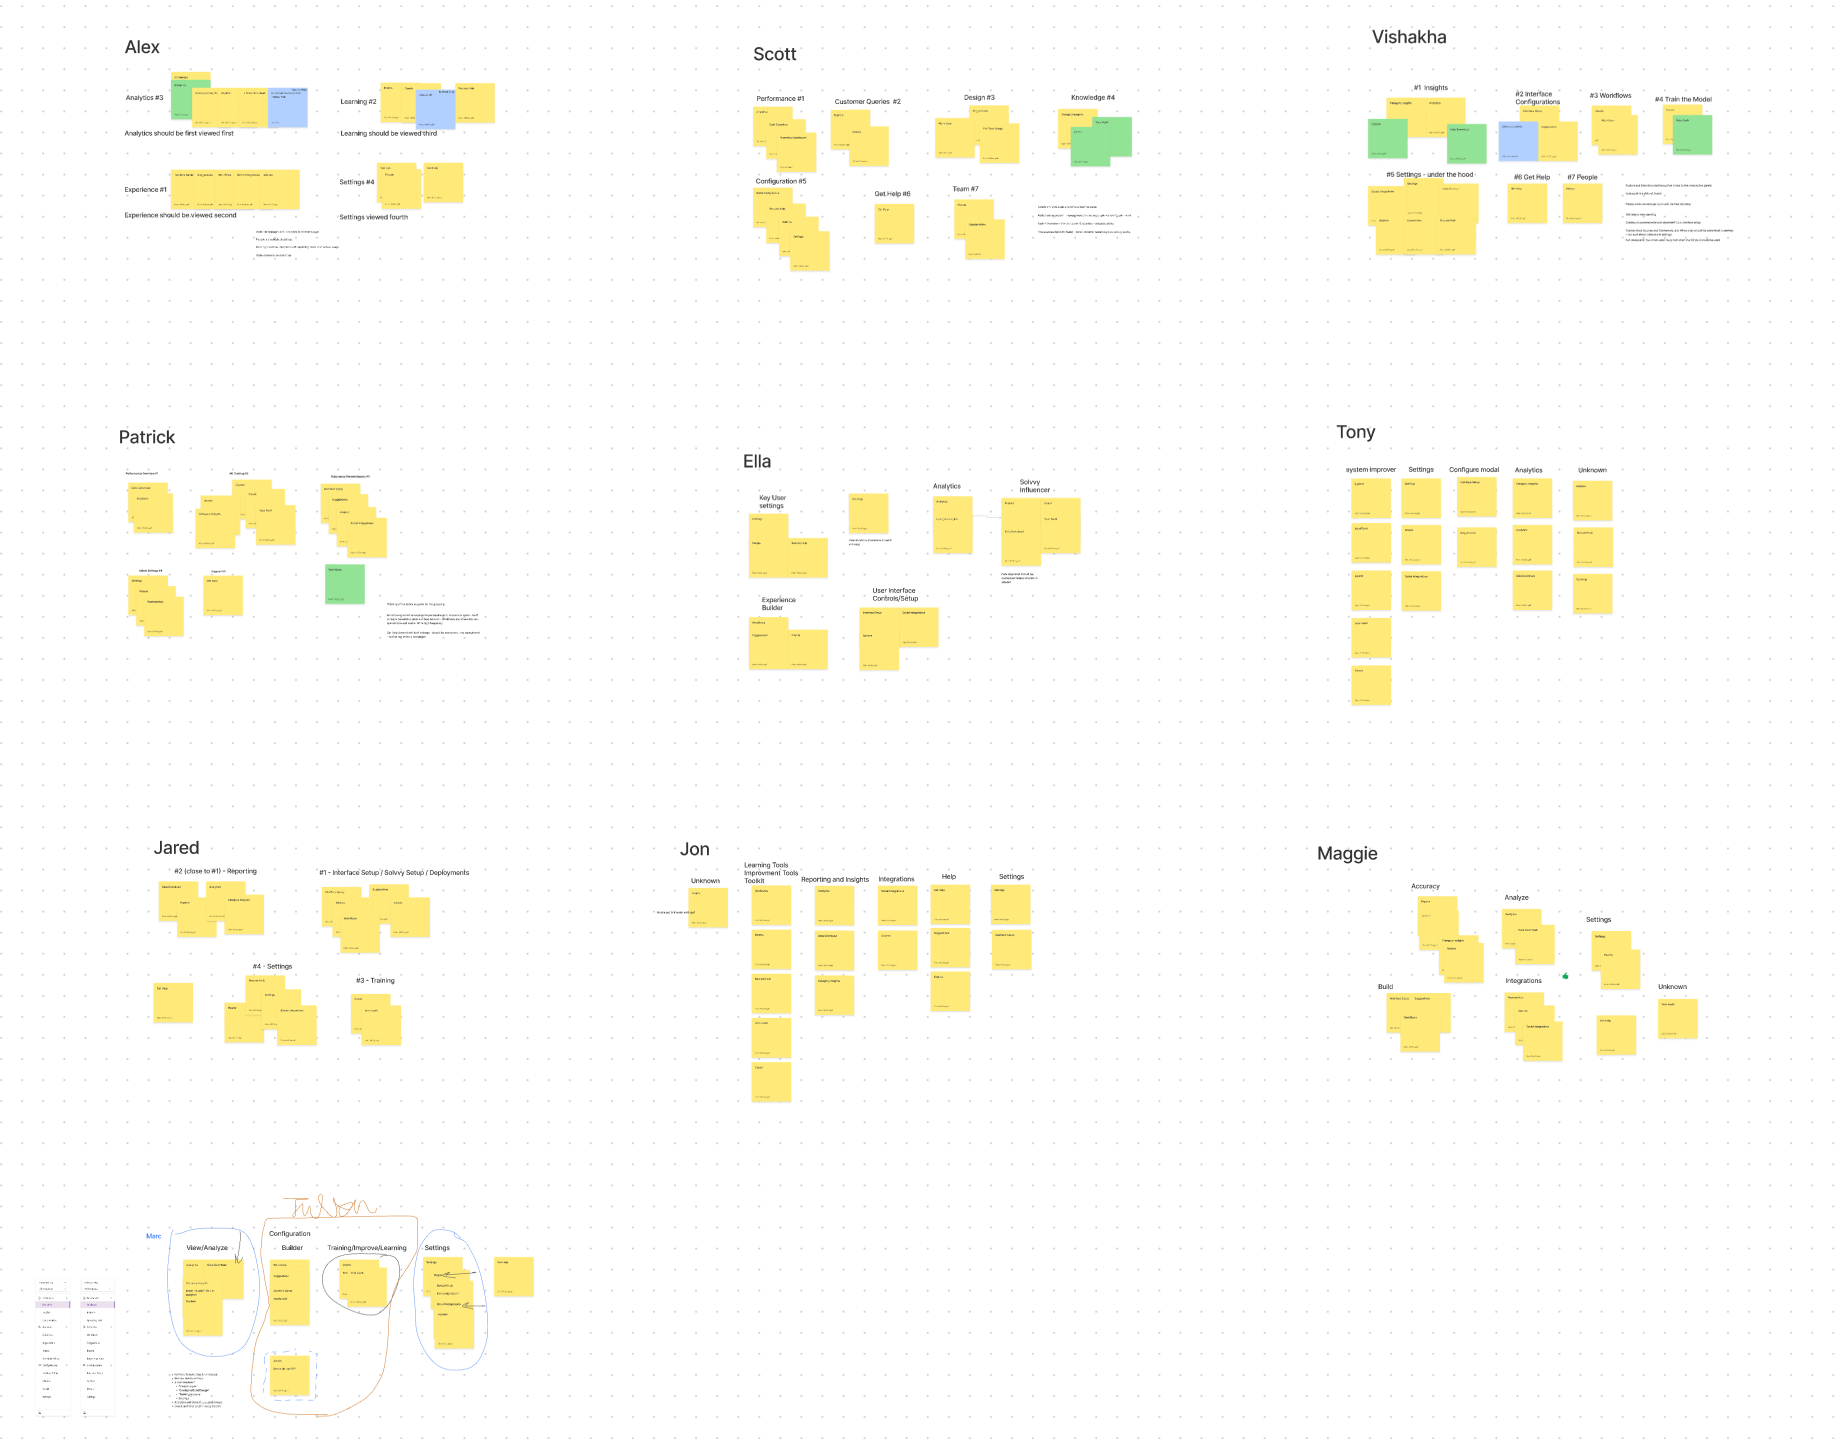
Information architecture
Involving the team to discuss potential updates to the architecture based on feedback from research.
Design Solution
After synthesizing and presenting my findings to the company, I was ready to start coming up with some design concepts. What I came up with:
Do a complete audit of current analytics based on feedback from interviews.
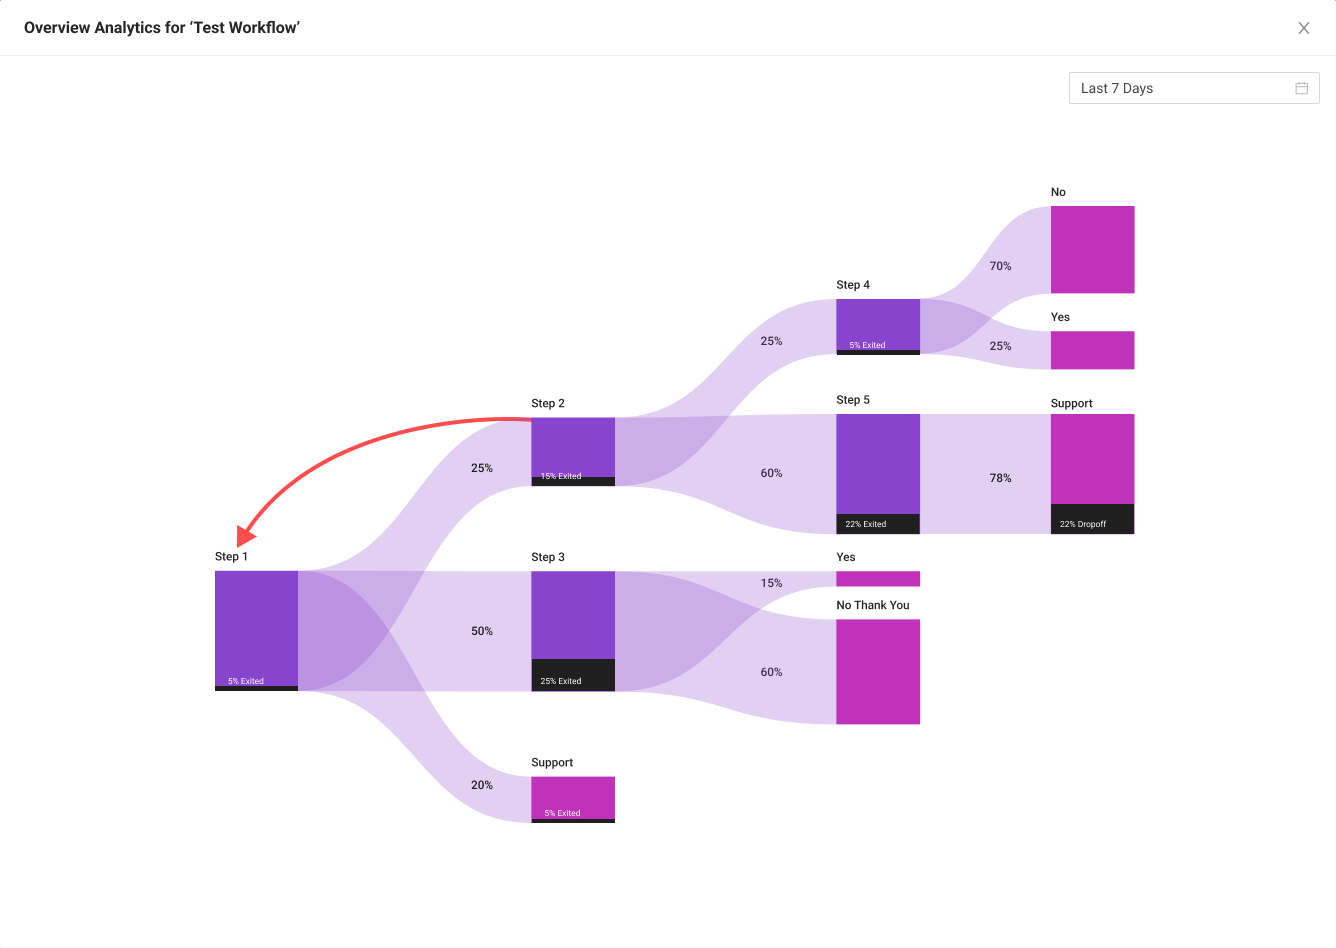
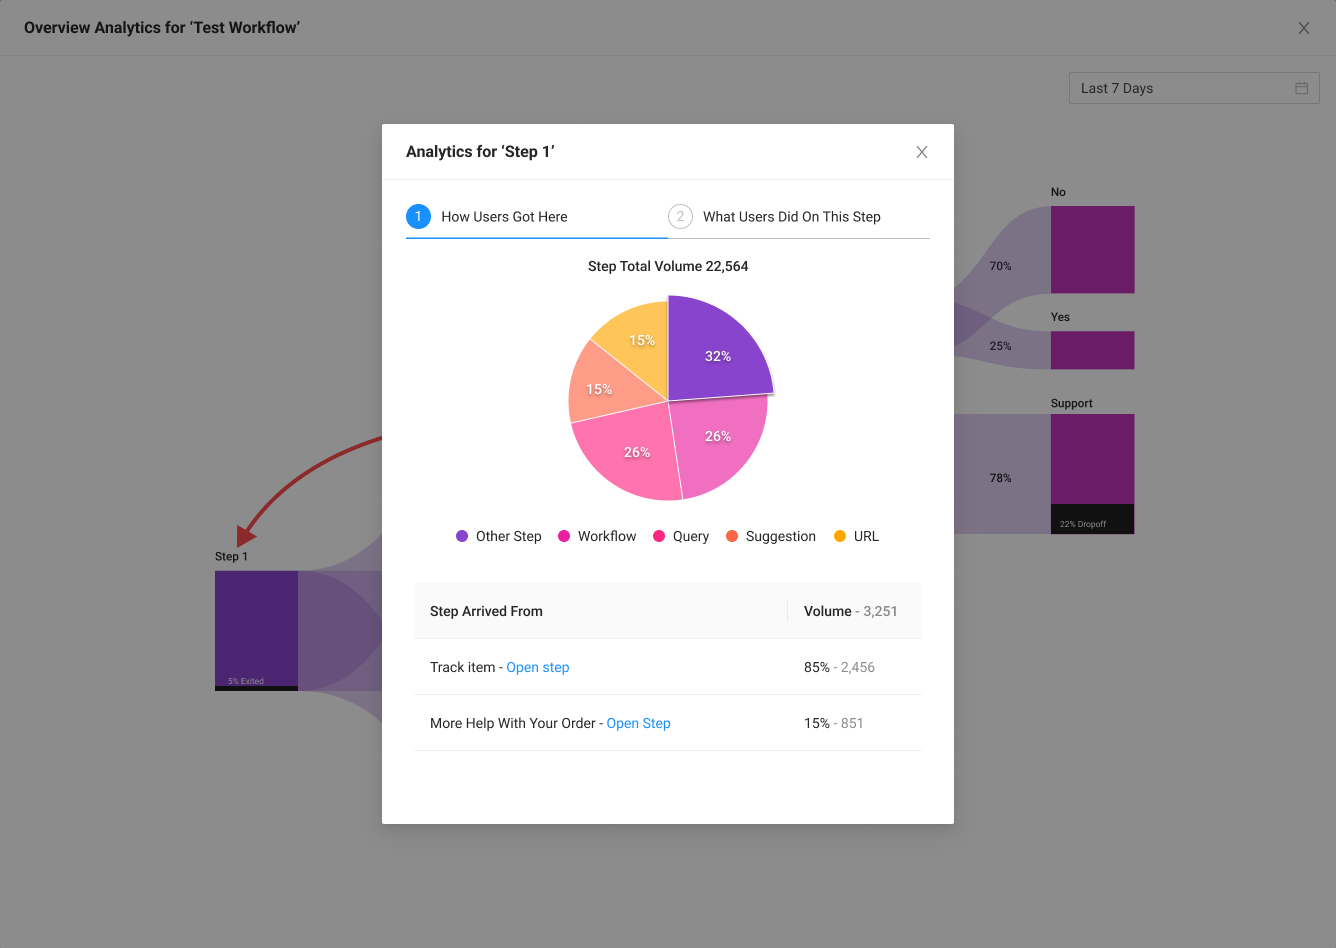
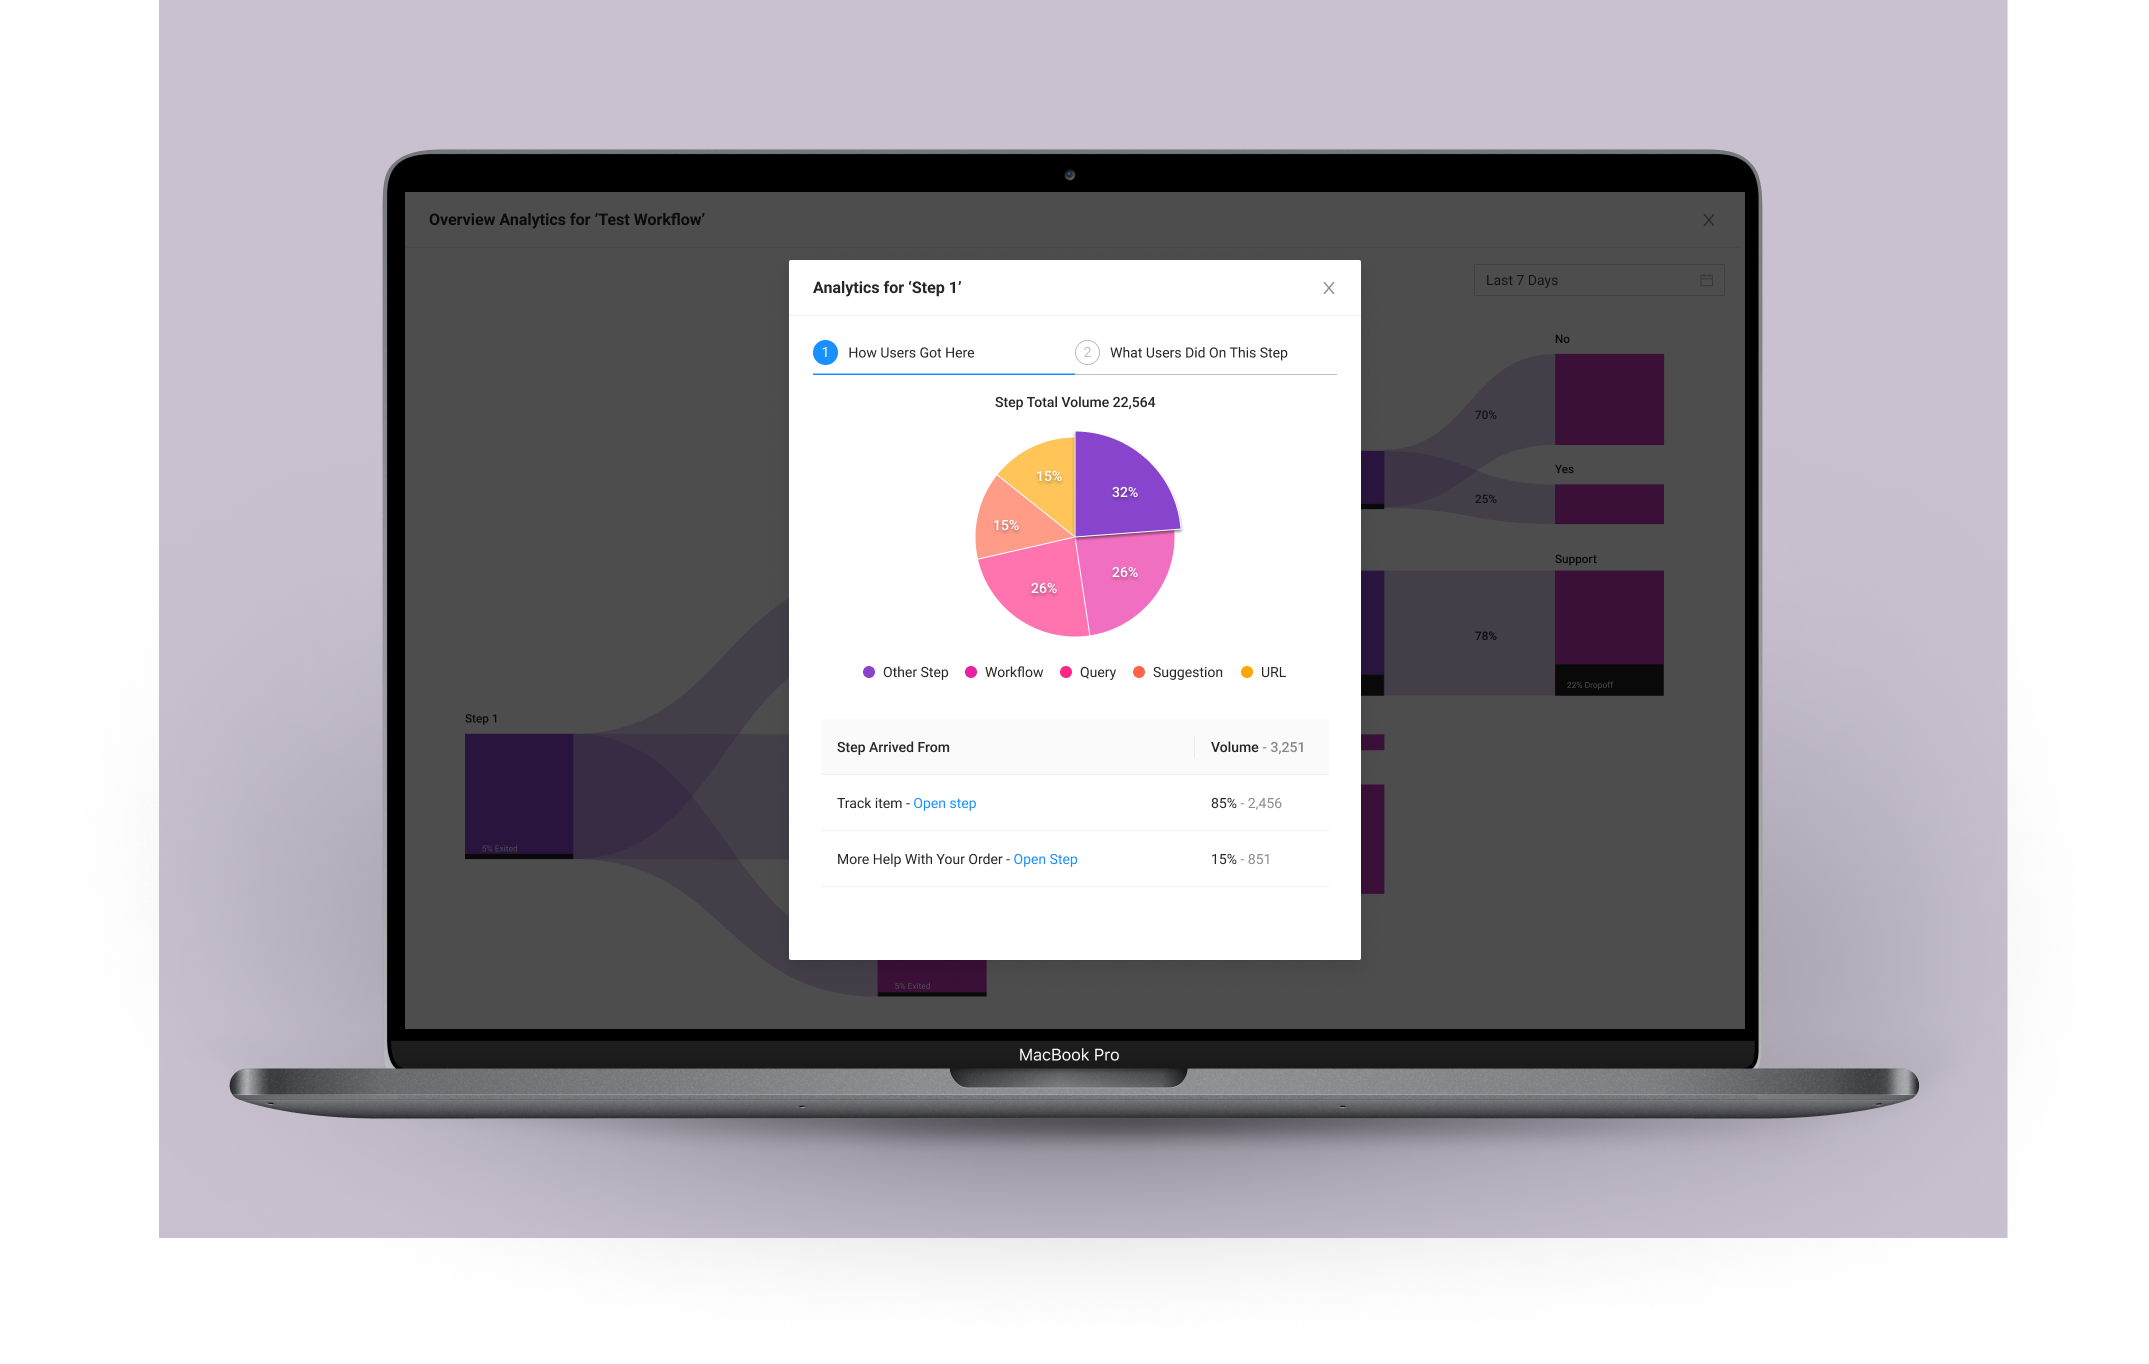
Create a Sankey Diagram view for each workflow in context, with the ability to see user journey volume from a high level, as well as the ability to click into individual ‘steps’ of the journey to see: how users got to that step, queries the users asked, links they clicked, buttons they clicked, and a lot more.
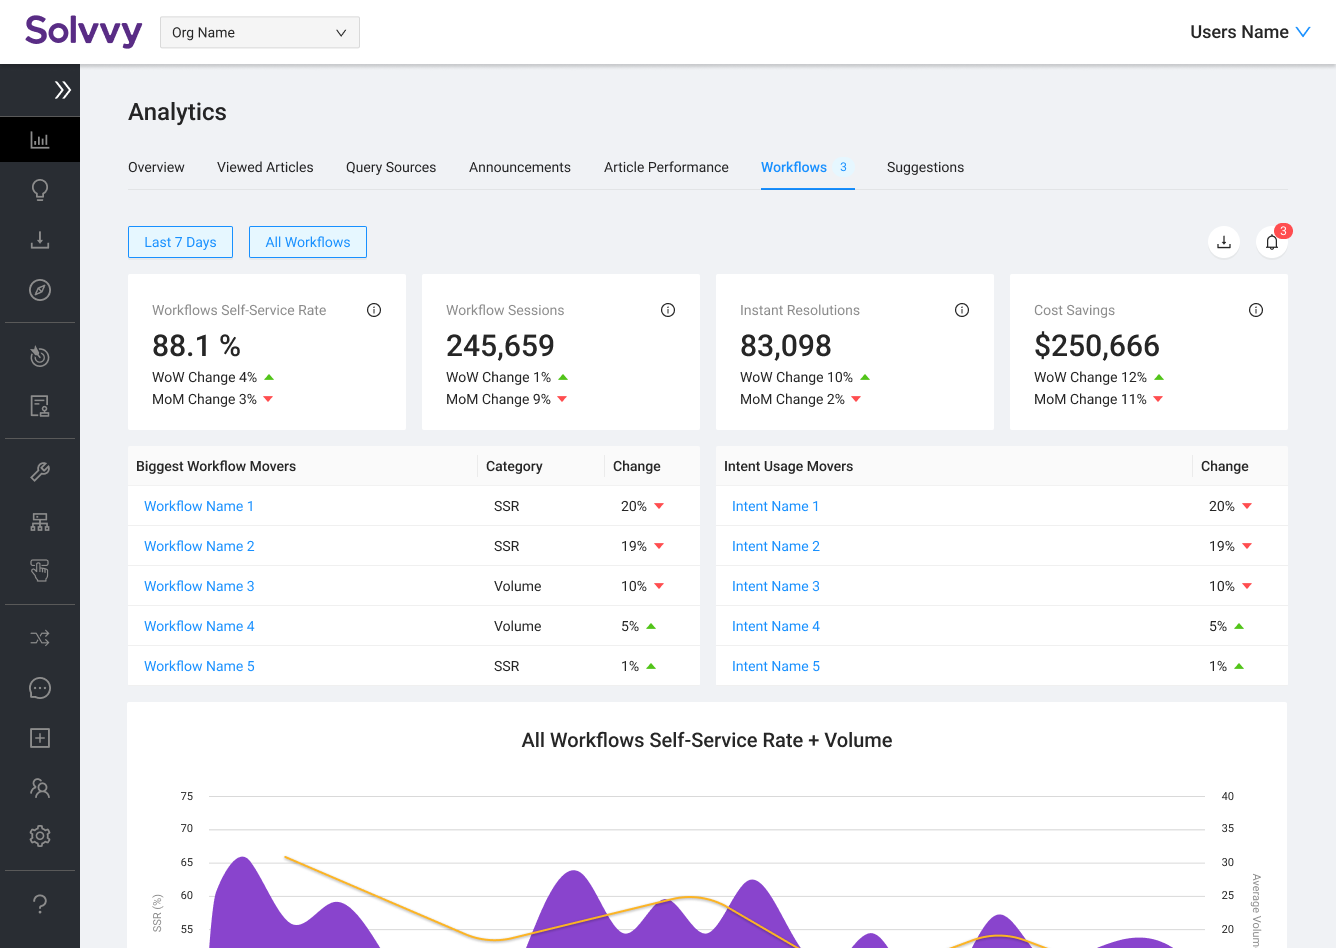
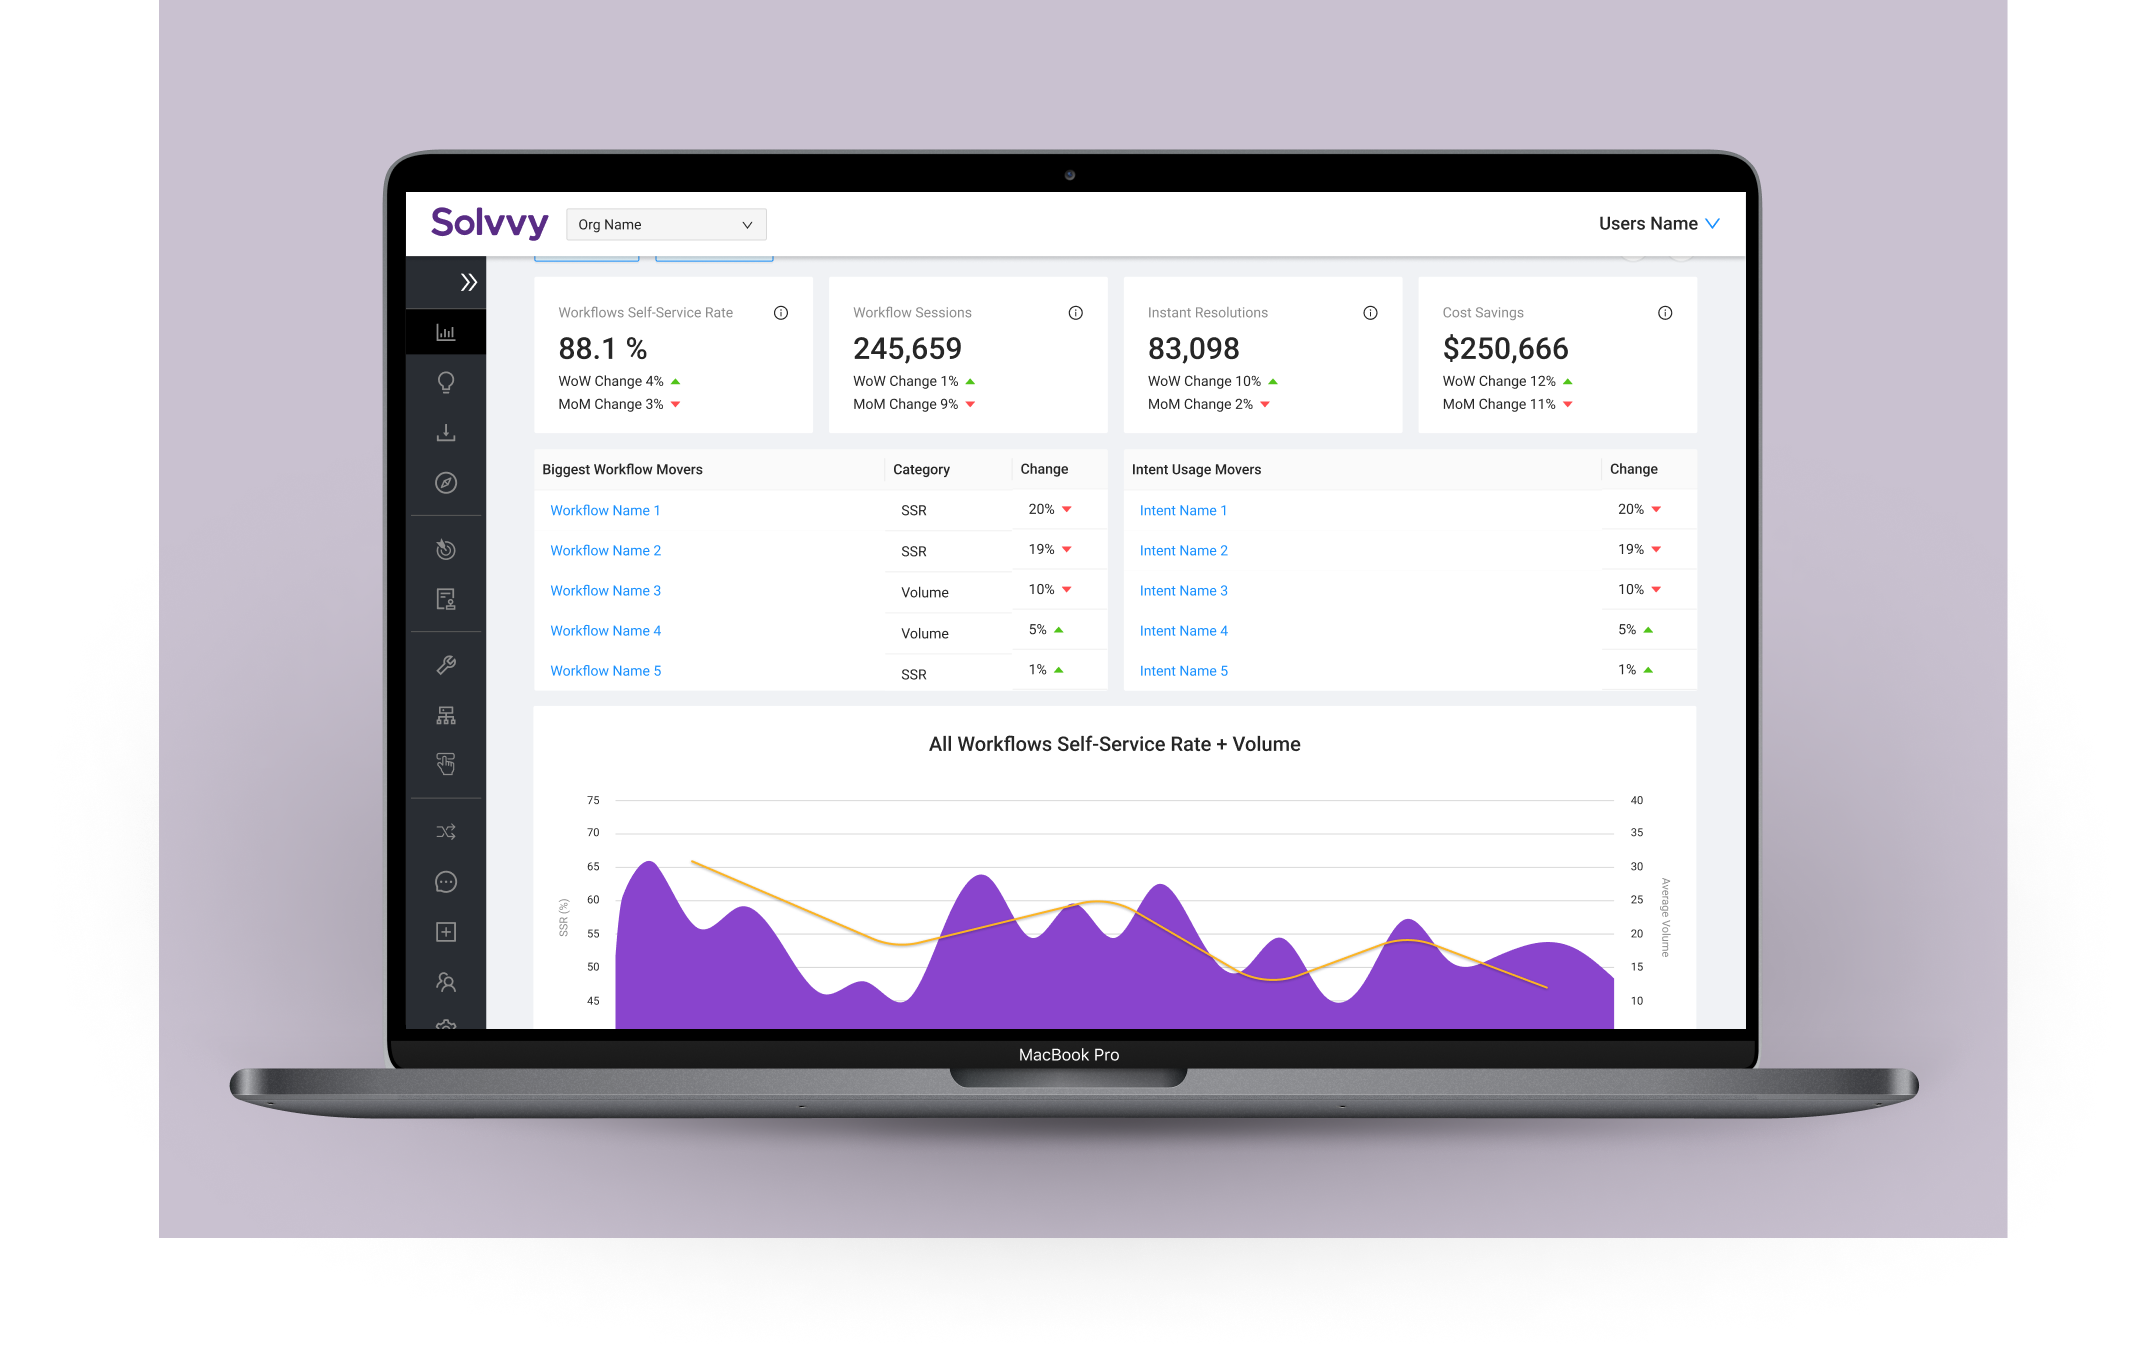
Create a high-level trends table which shows greatest changes in volume and self-service rate among all workflows.
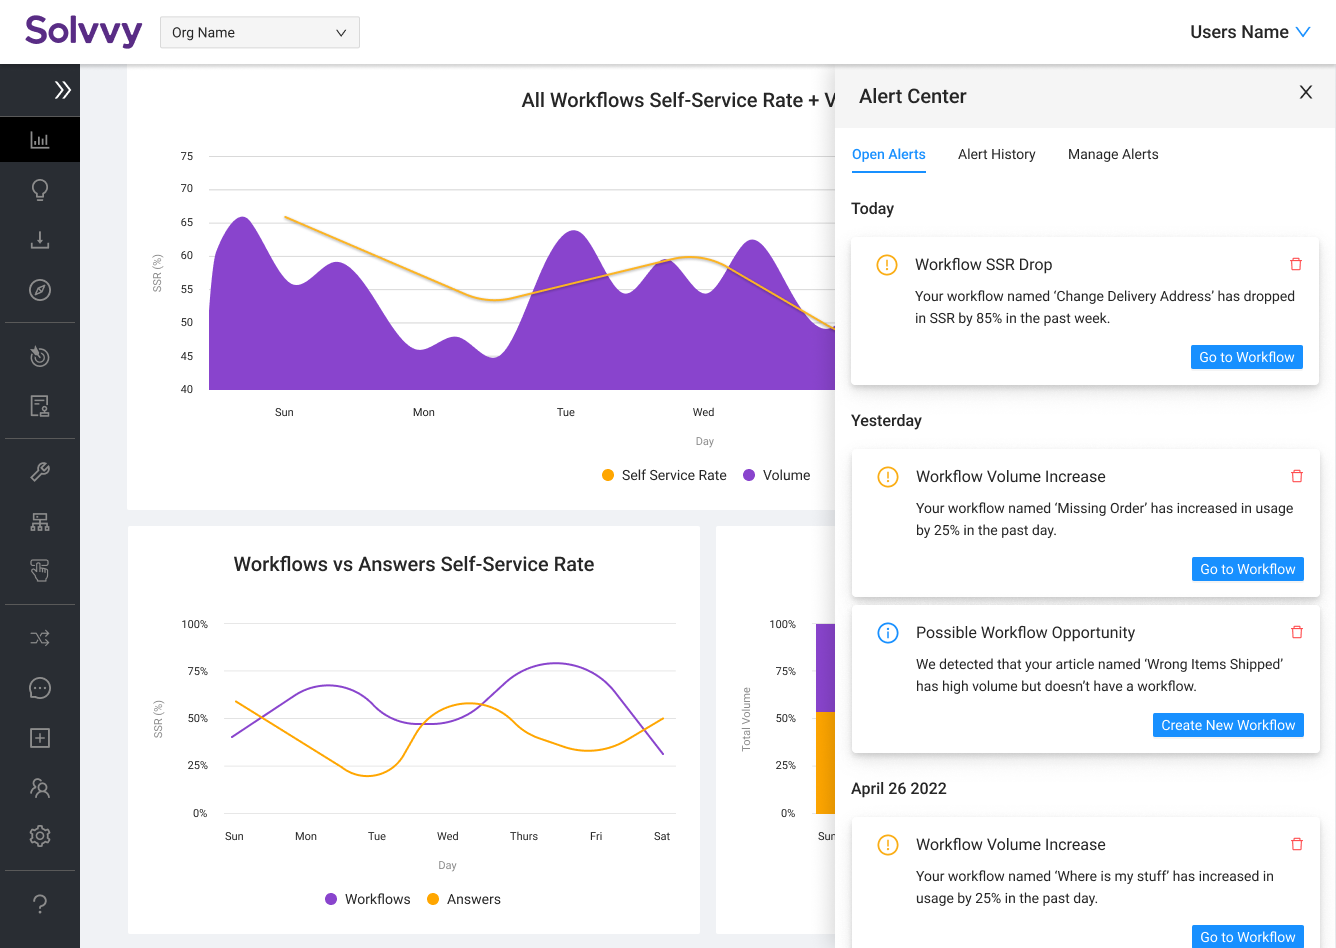
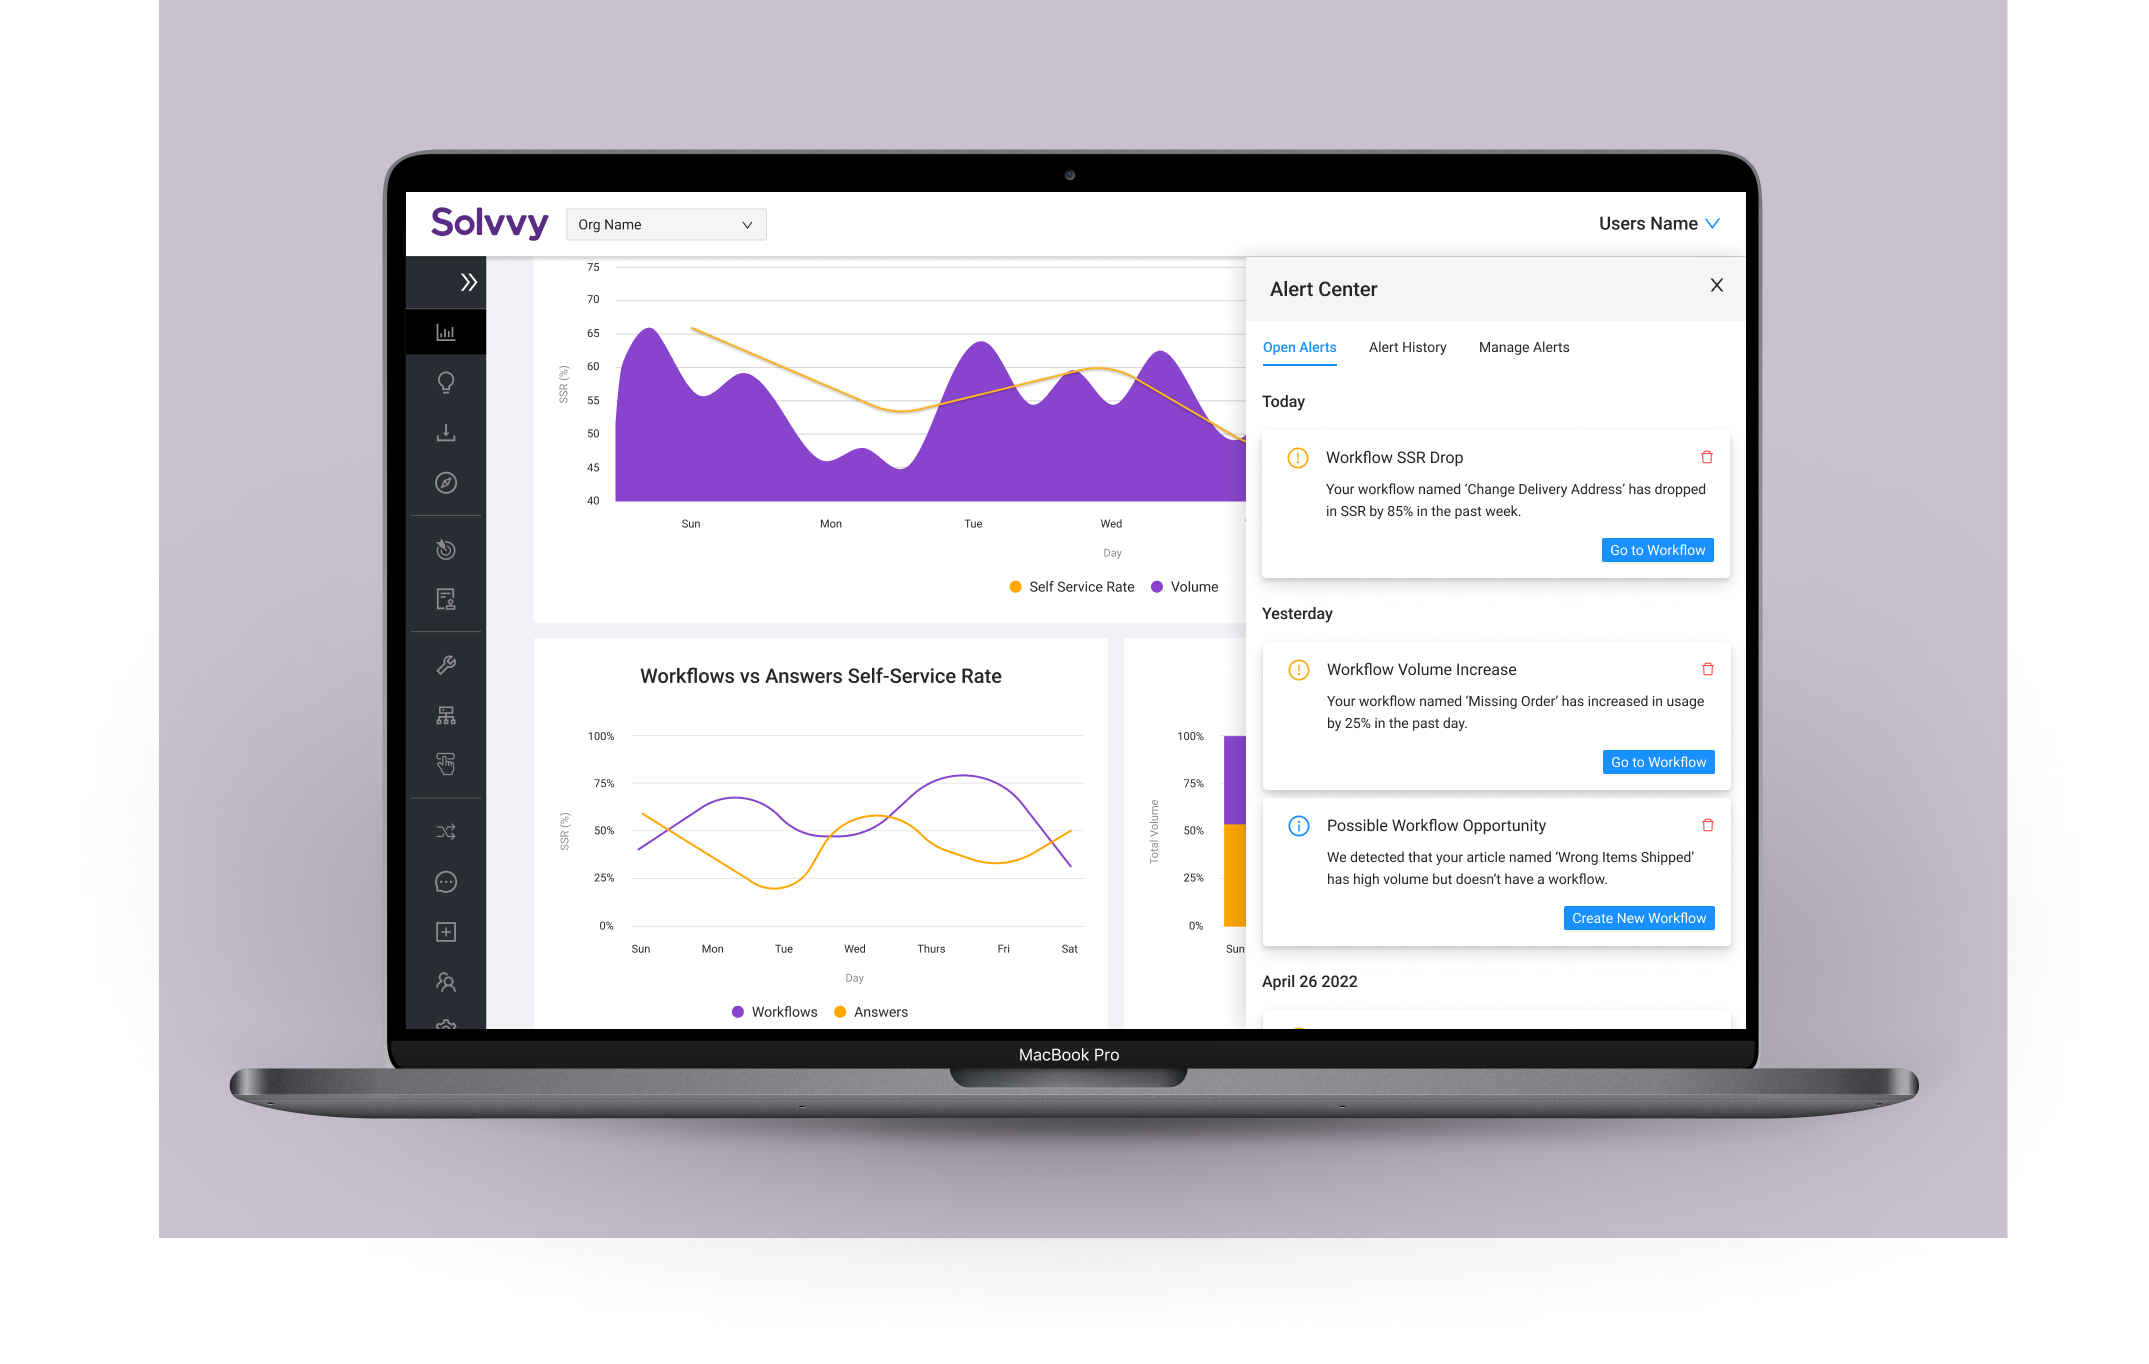
Create actionable, configurable alerts that users could set up to show changes in their workflows - which could signal greater issues in their organization.
Create a simplified explorative dashboard for users to use to deep dive into their workflows and how their users are interacting with the chatbot overall.
Consider overall information architecture and UI refresh for consistency in a future project. (seen below)
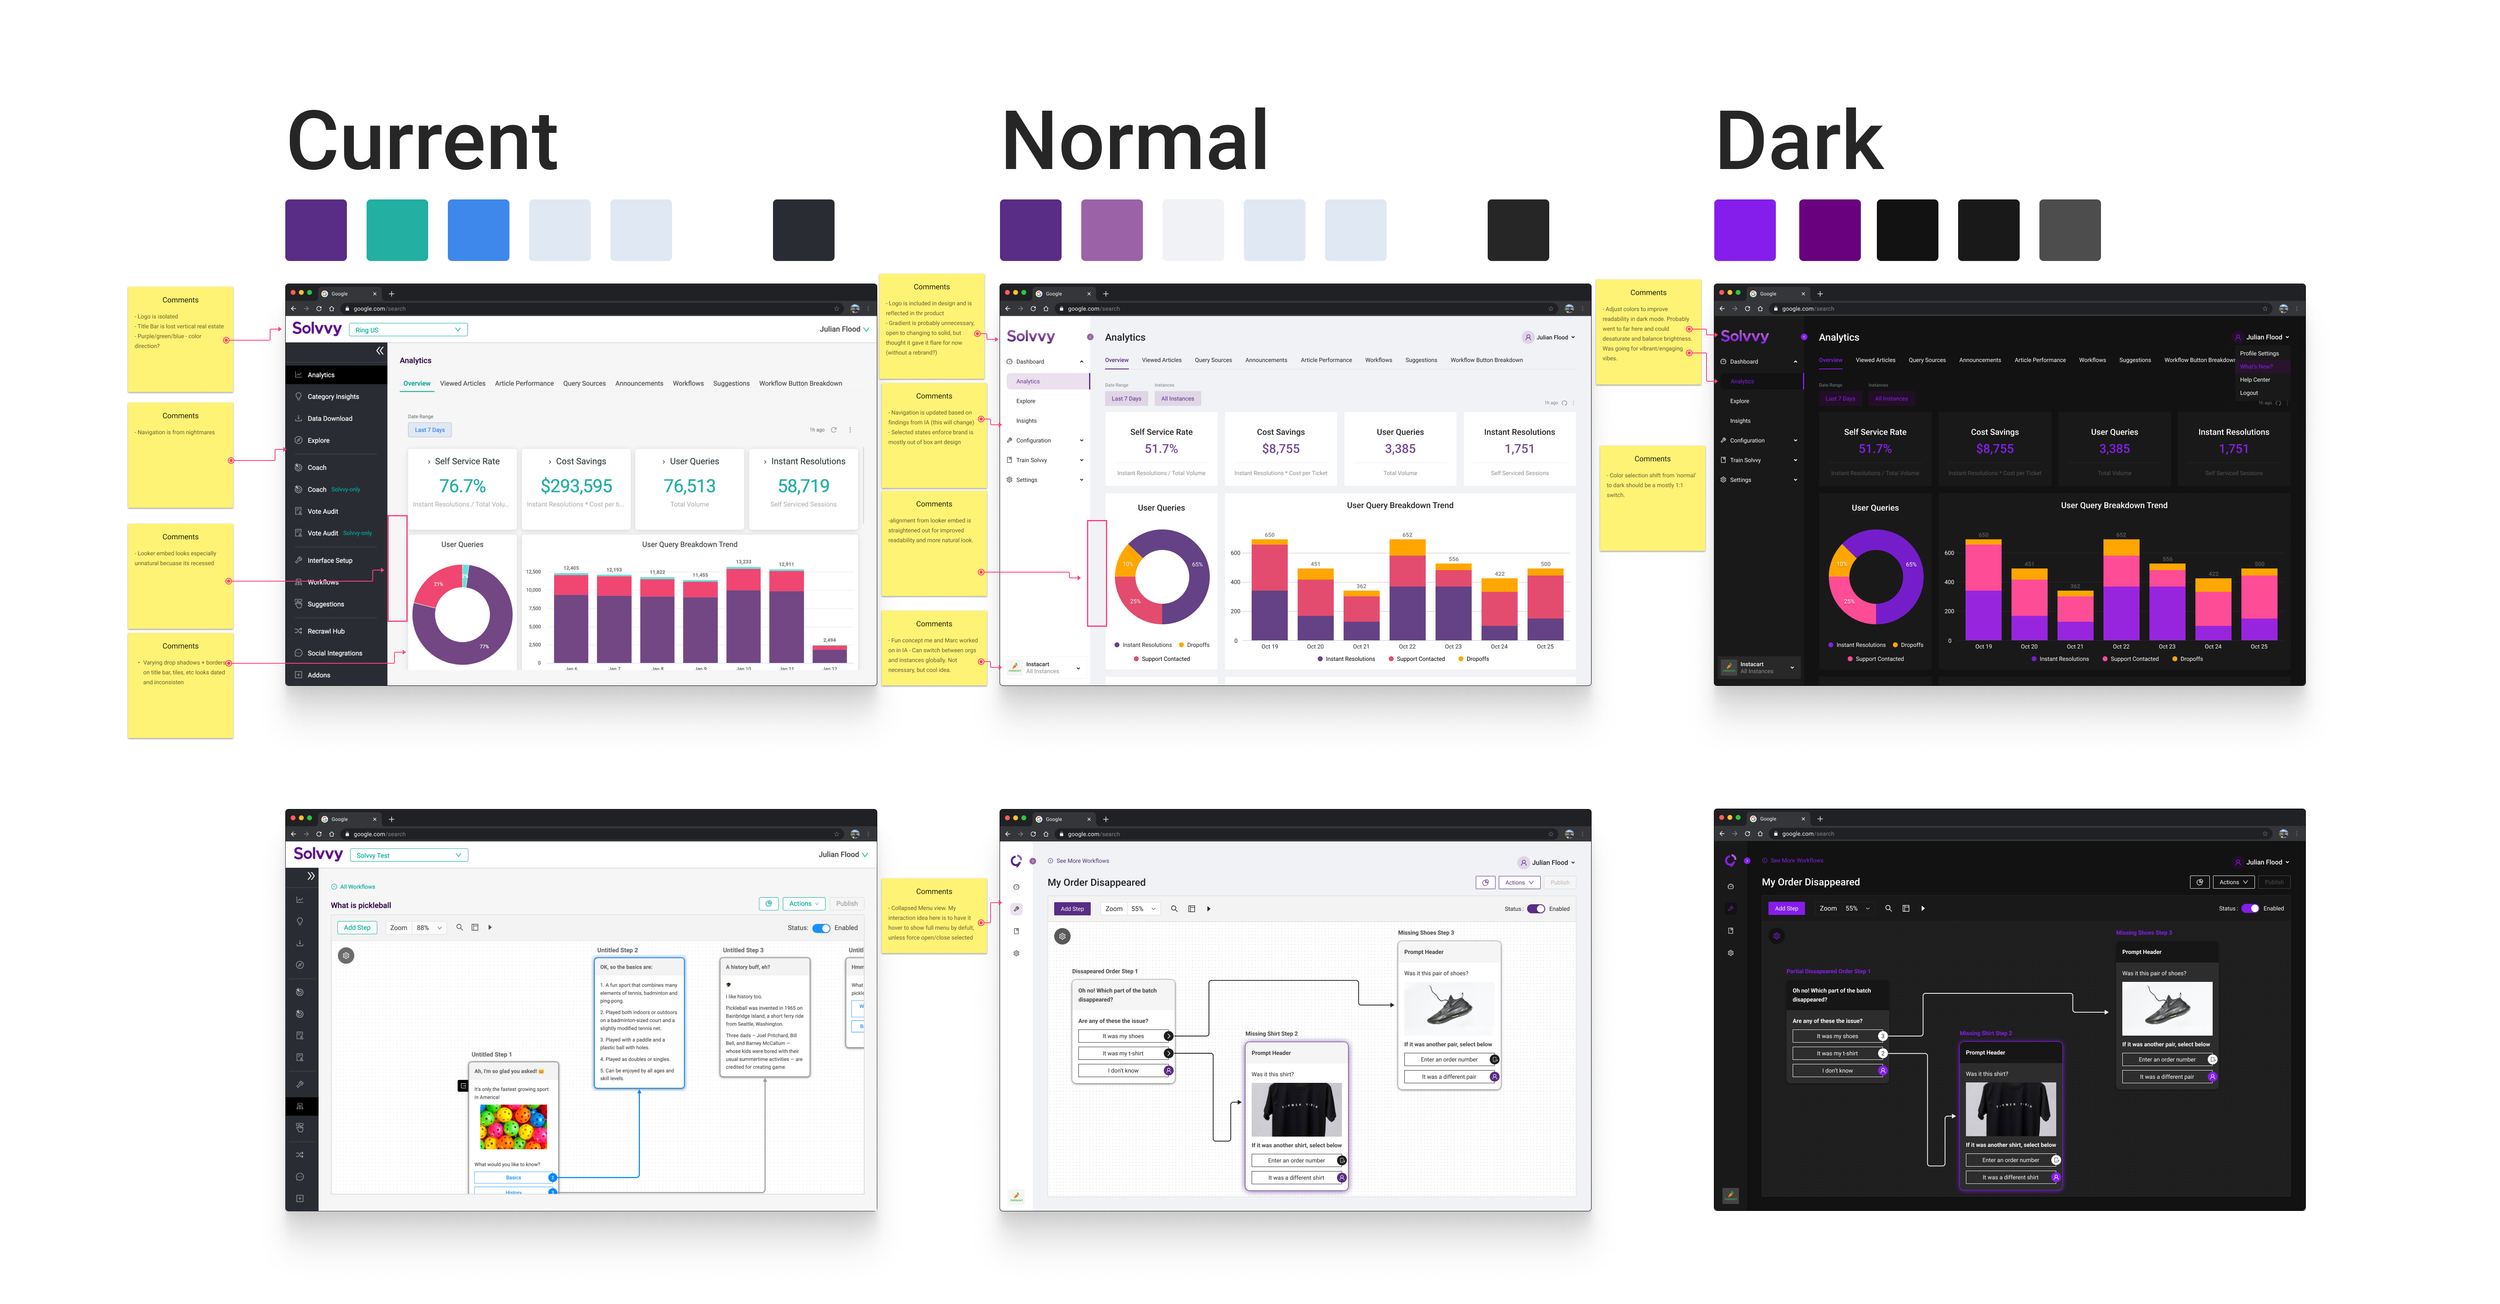
A suggested update to improve Information Architecture as well as UI consistency in the product.
Design Validation
After working diligently with our internal teams to get a solid first version established, it was time to validate my design solutions. I ran another round of interviews and prototype walkthroughs with the new solutions to understand if the problems were effectively solved. Other than some small tweaks needed to the standalone report, our clients were ecstatic about the new report. The Sankey diagrams were the star attraction, but users also loved the new customizable alerts:
“Whoa that’s pretty cool. I didn’t even know that was something that I needed, but I could see this being really powerful. I could see this saving me a lot of time.”
UX Metrics
How did I know I was successful or not once the project was released?
Aside from the qualitative follow up research described above, tracking overall adoption and usage of the new product seemed logical.
For the contextual Sankey diagrams, we kept the original button to launch the old analytics, and introduced a new one by its side. We measured its usage and hoped to achieve 100% or more adoption than the original offering within 30 days. We also measured time spent on page after opening - our goal was again to double the amount of time of the original report.
For the standalone report in our analytics section, we measured time on page versus the 30 day average of the prior report.
As you can see below, we far exceeded our goals even within the first few weeks. After a month, numbers were even more staggering.
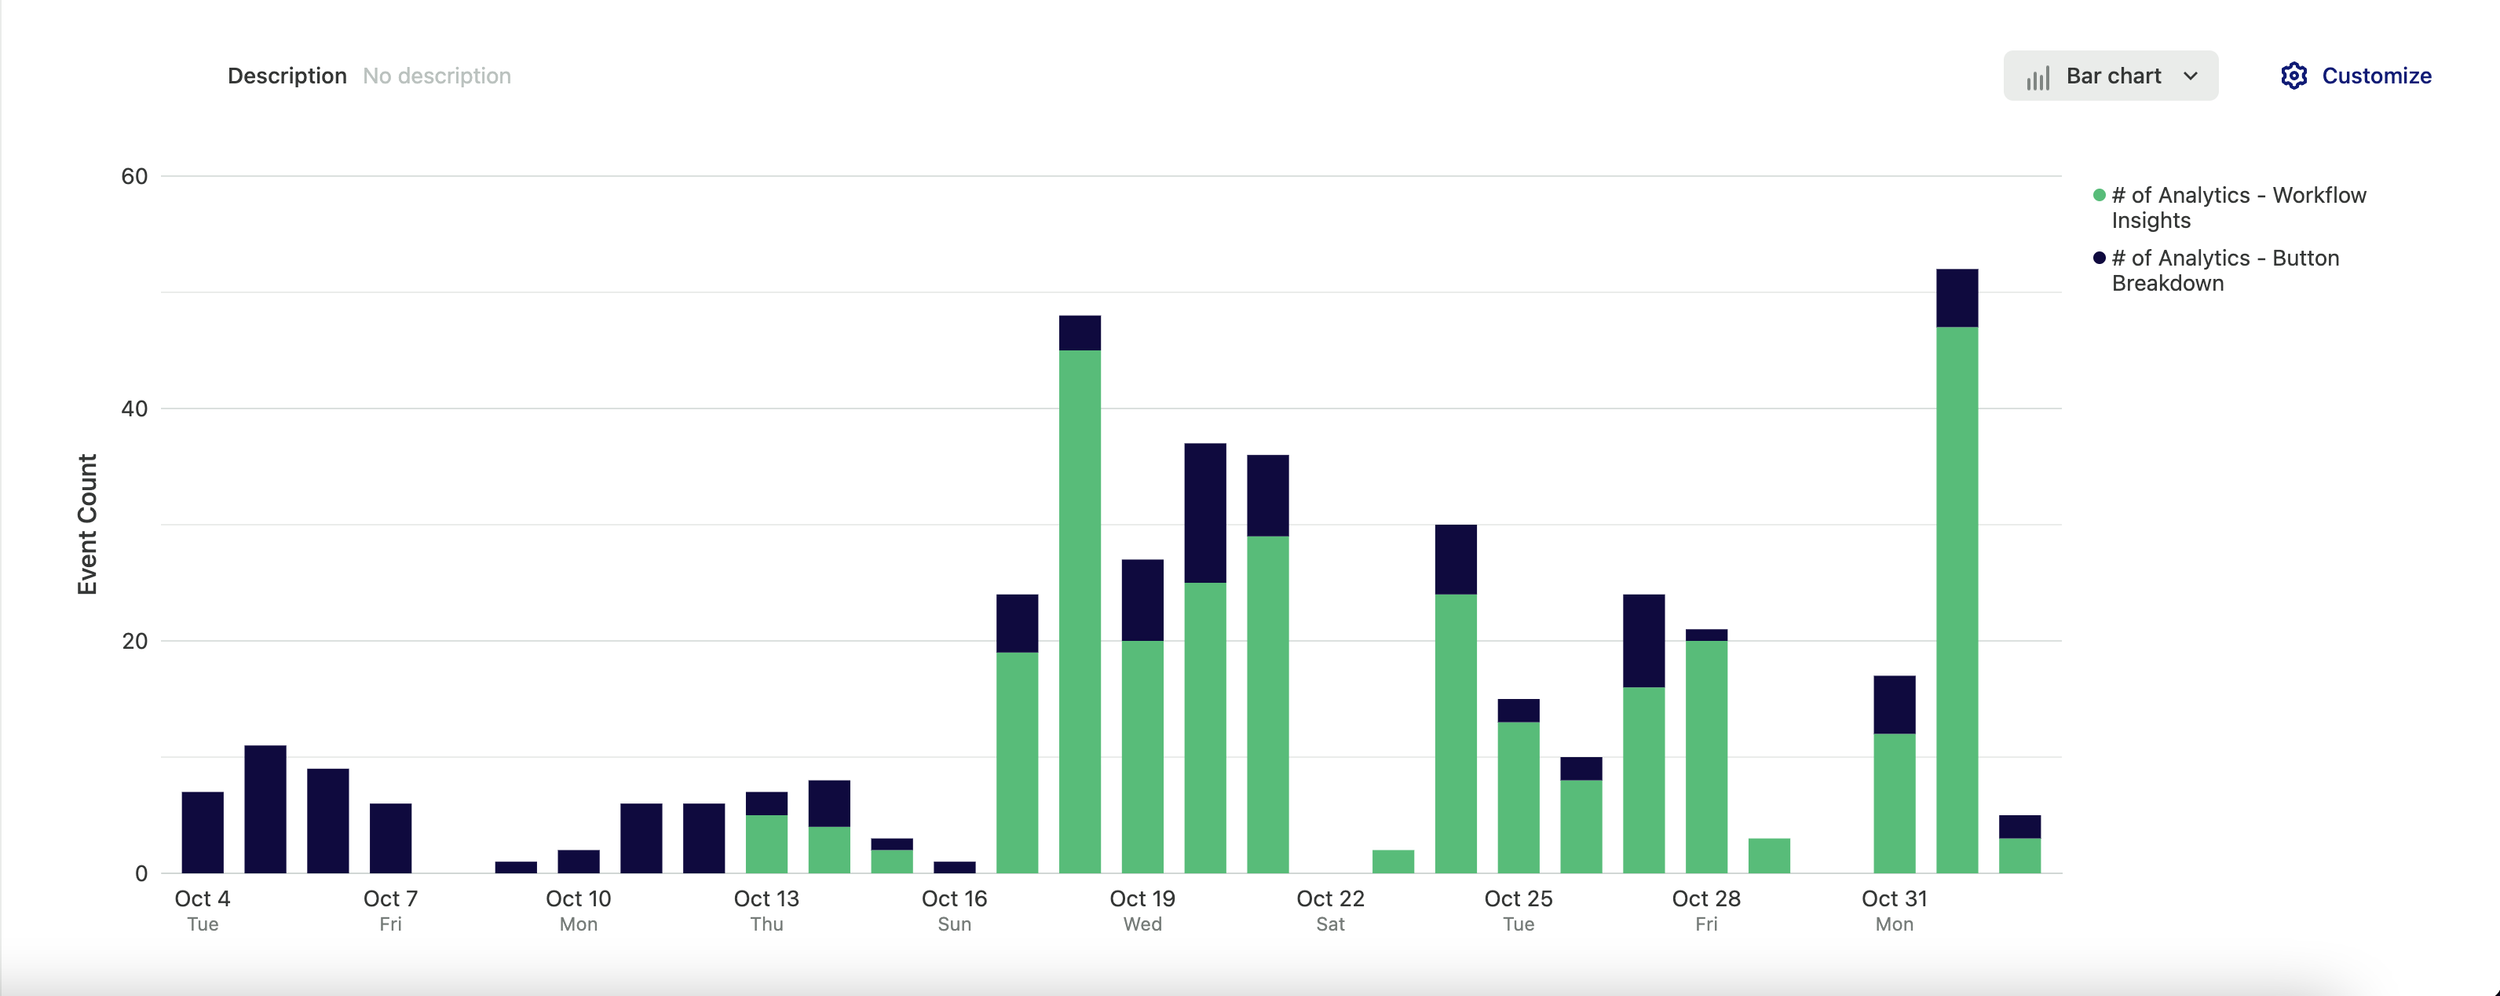
Event tracking to understand usage of the new analytics and reports.
Results
Overall the project was very successful. Clients couldn’t wait to have it implemented, and once it was, all of the success metrics were met at the minimum - some exceeding over double of our original goal.